Sonder
n. the realisation that every passerby is living a life as vivid and complex as your own.
We plan from the trips those people make.
Beta Mobility runs Sonder on movement data you already hold and the timetable you already publish. It shows where people travel, where the timetable does not follow them, and which mix of services would. Beta sells neither vehicles nor software, so the answer is not decided before the data is in.
What you bring.
Your movement data, in whatever form you hold it. Your timetable, usually as GTFS. And the question on your desk: a corridor that fills up at eight, a district with no bus after ten, a feeder line someone wants funded.
We load the first two and build the walkthrough around the third. Nothing to install, nothing to sign up for.
Nobody here sells a bus.
A vehicle maker's planning tool ends up recommending a vehicle. Most gaps are closed better by a mix: a rerouted line, an on-demand shuttle after ten, a bike share station at the far end of a corridor, or nothing new at all. Sonder puts those options side by side on the same demand.
A report answers the question you asked when you commissioned it. A scenario you can change during the meeting answers the one being asked now.
Four moves. One map.
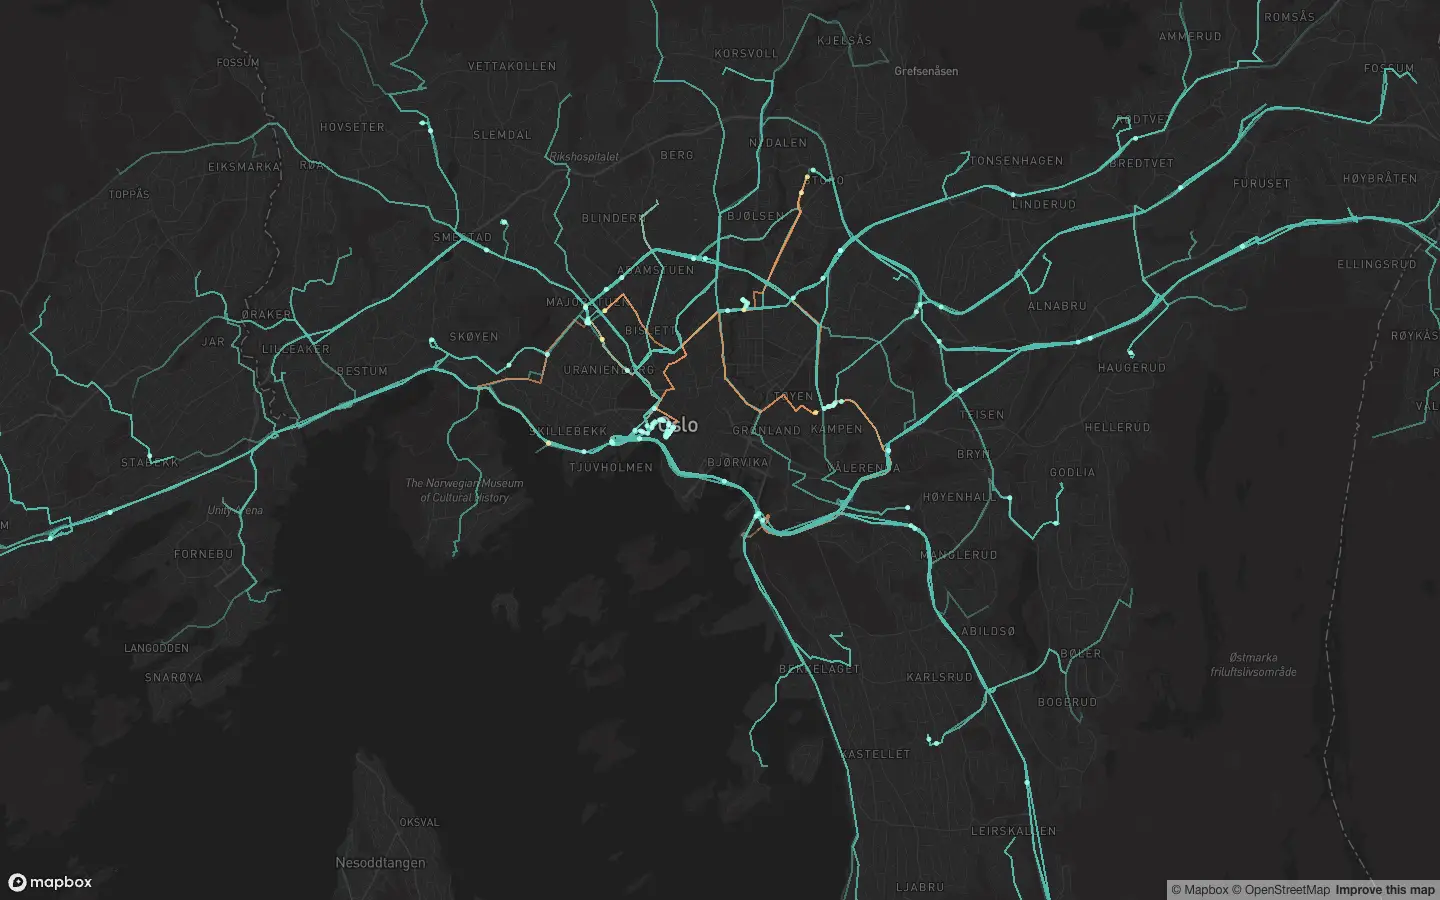
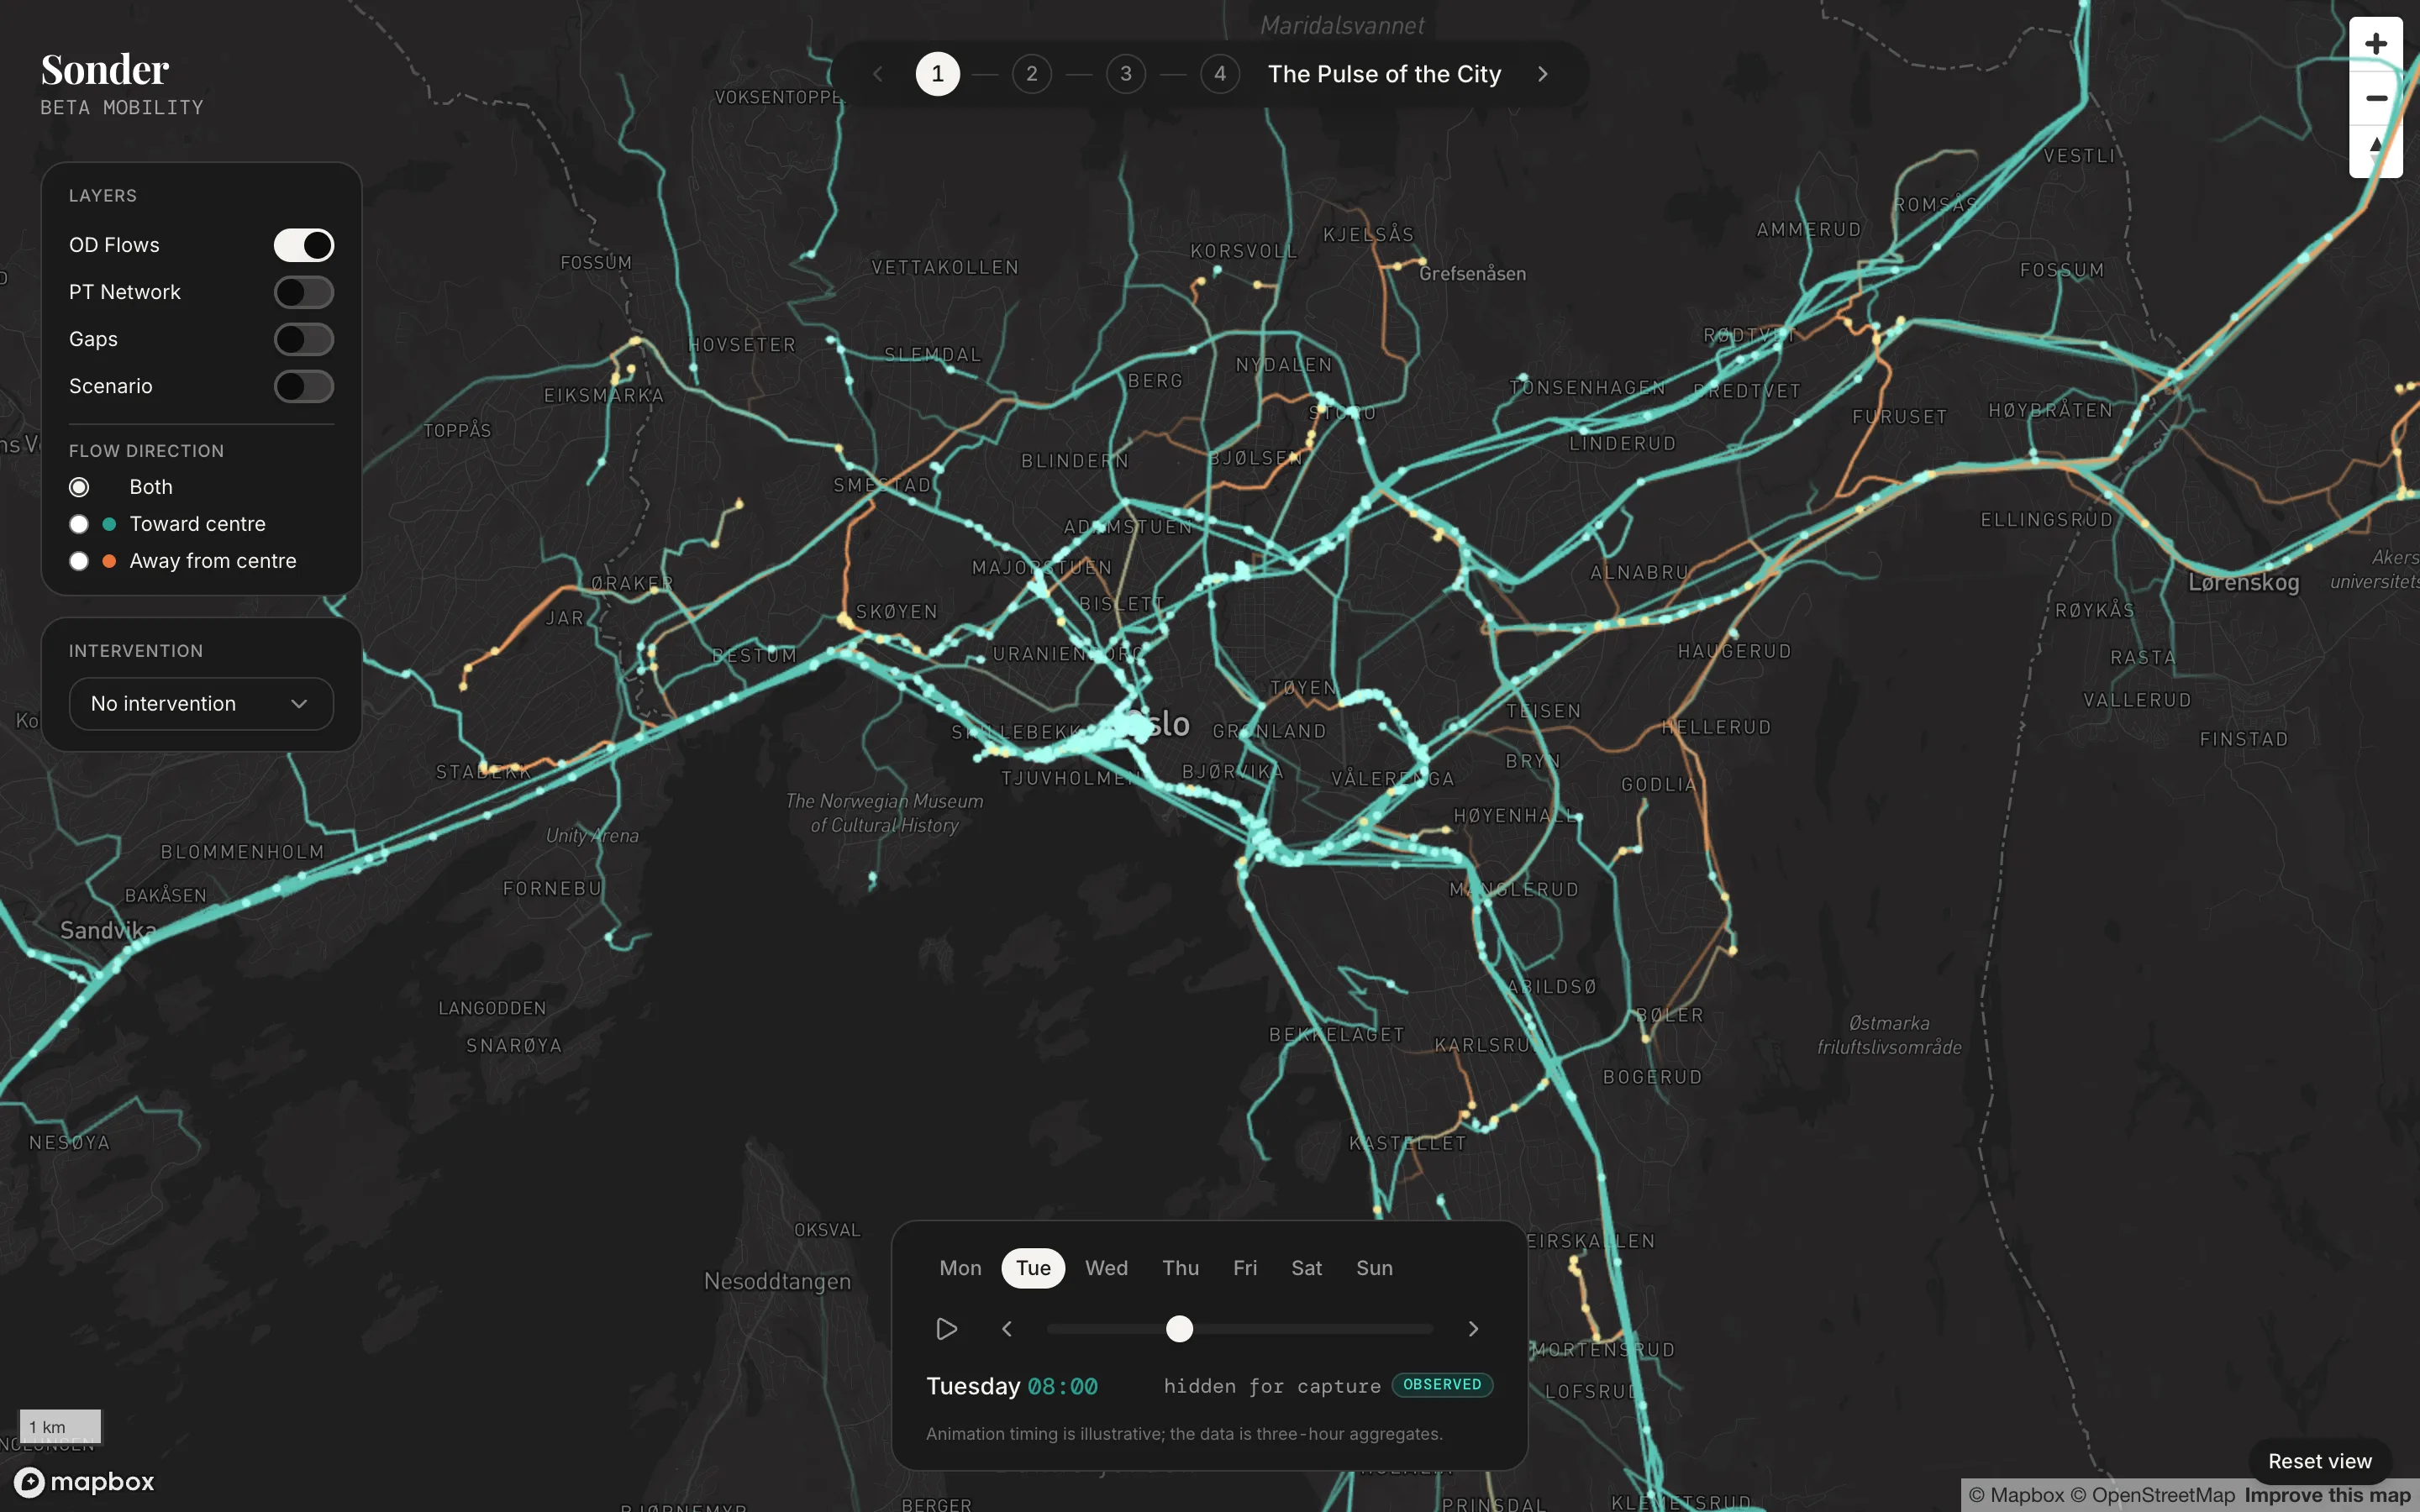
ObserveOrigins and destinations by hour, drawn over the streets people use.
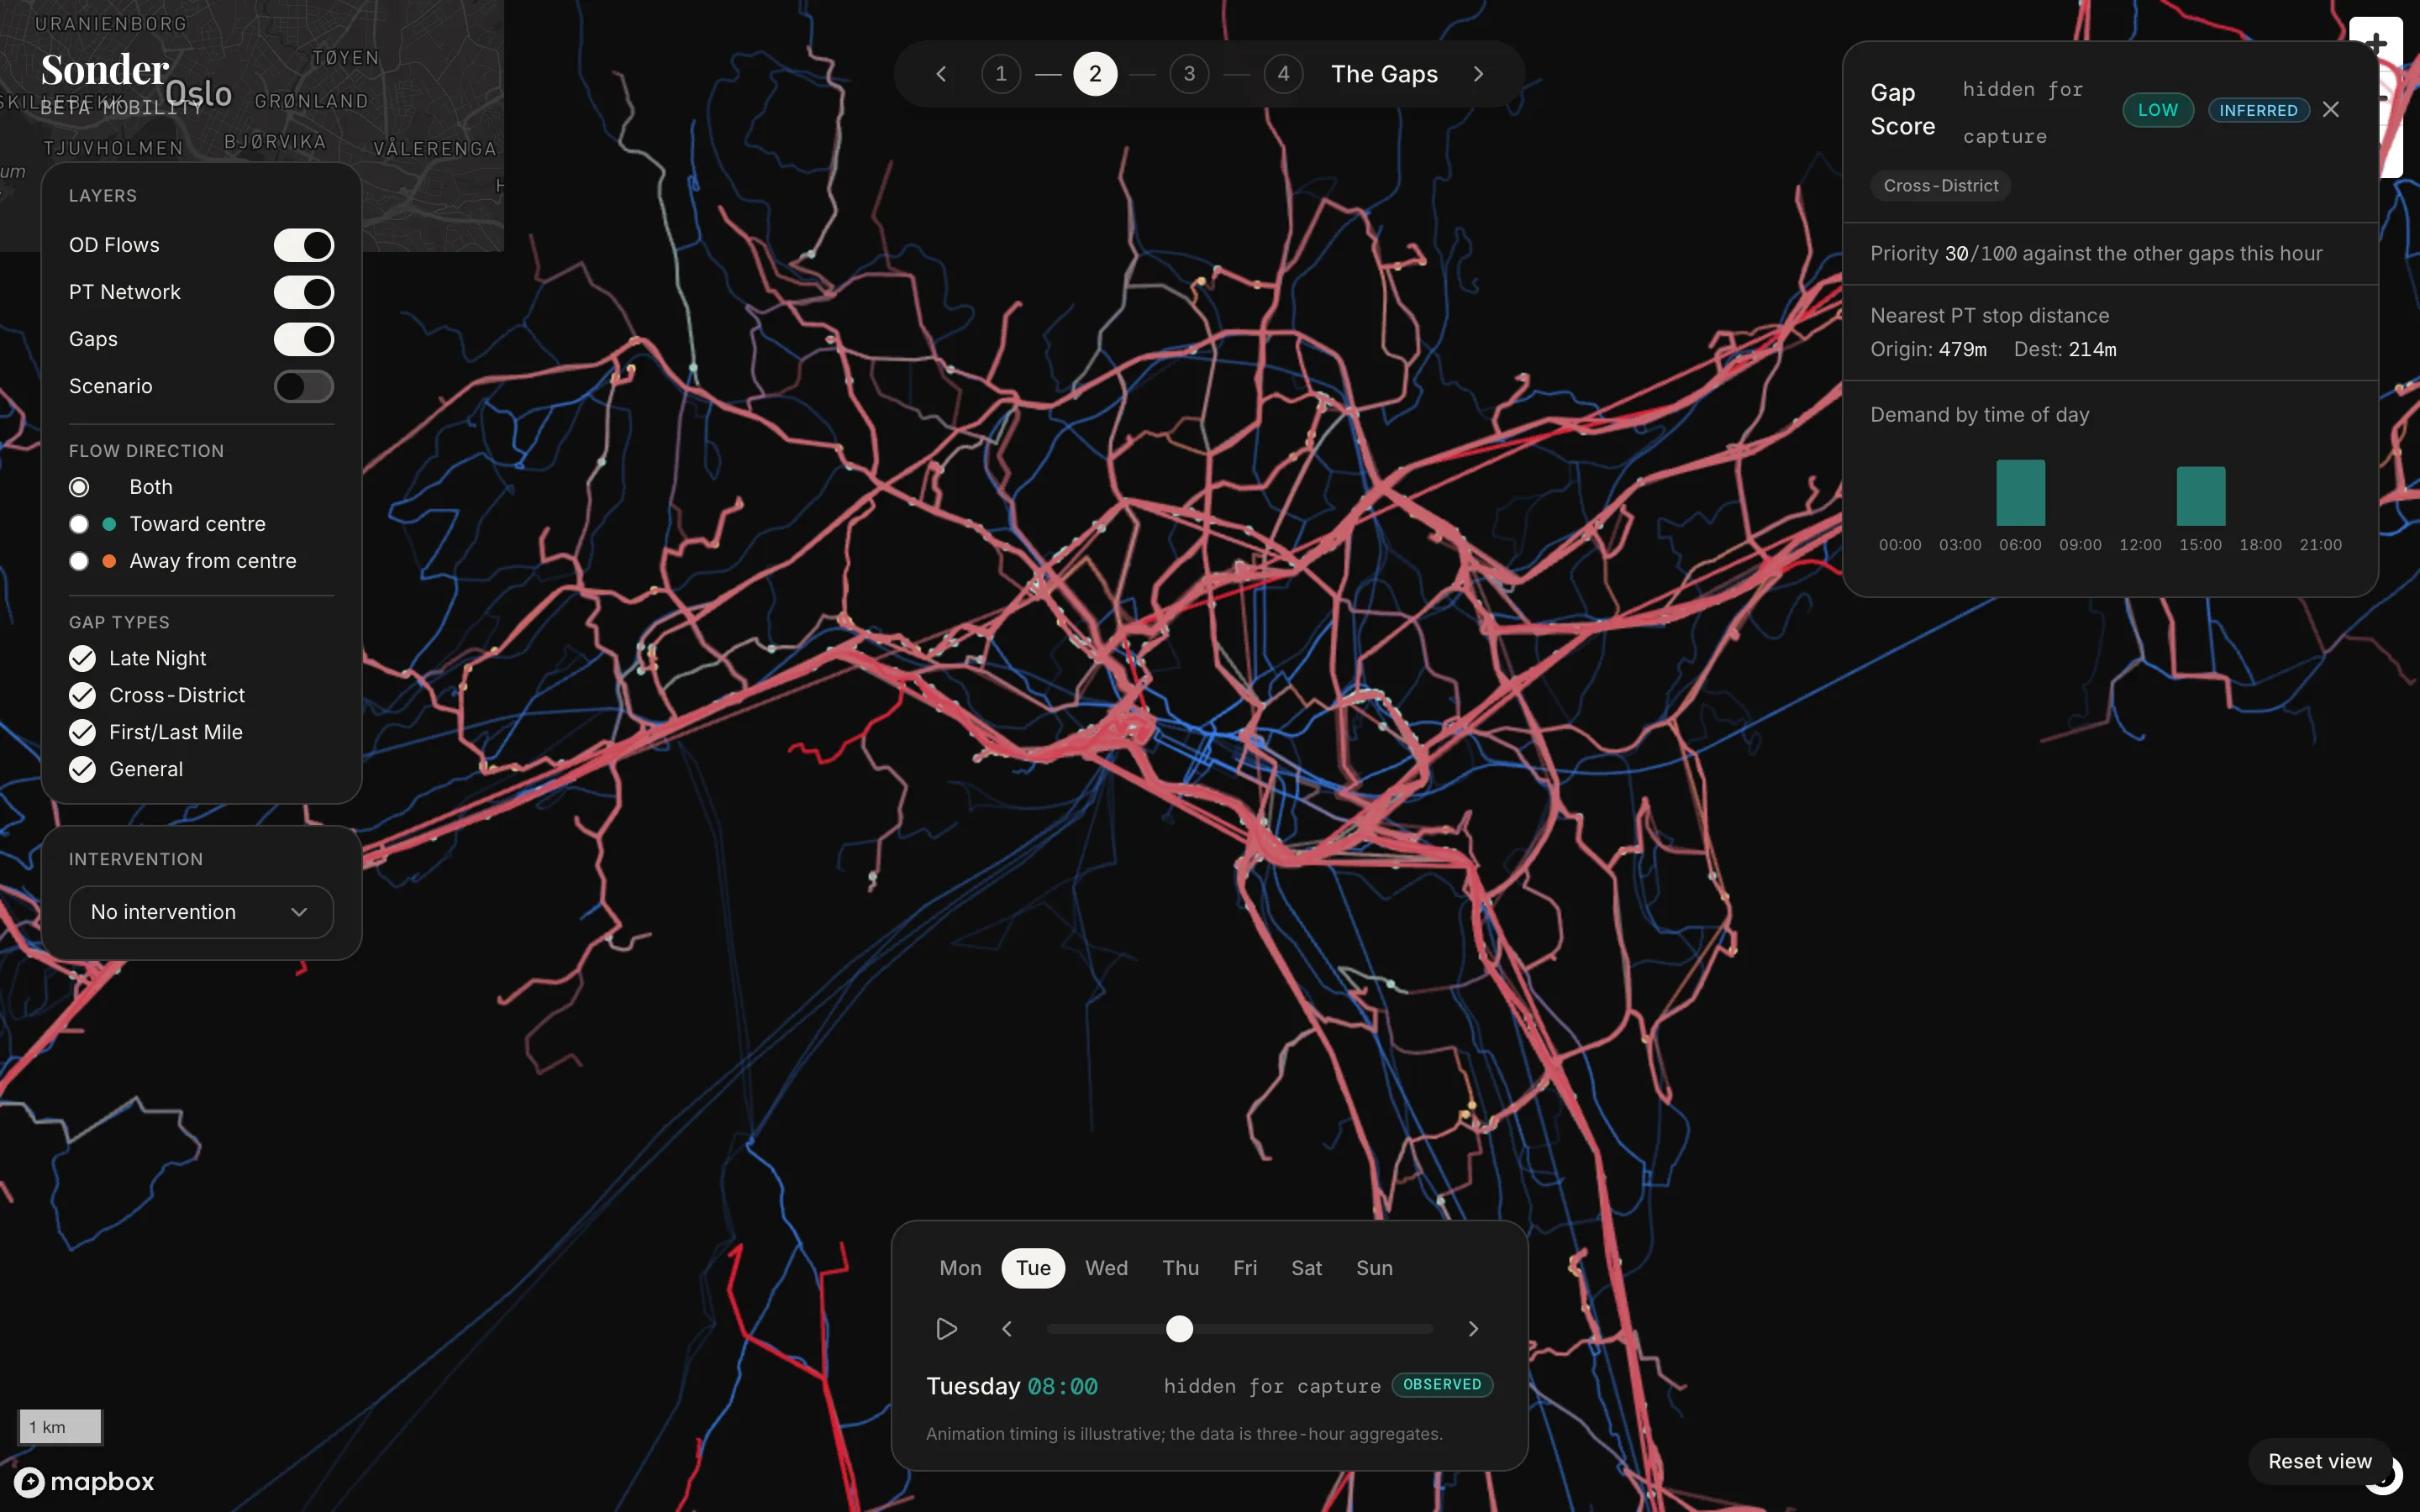
InterveneEvery corridor scored on the departures within a short walk of both ends, at the hours people travel, weighted by how many do.
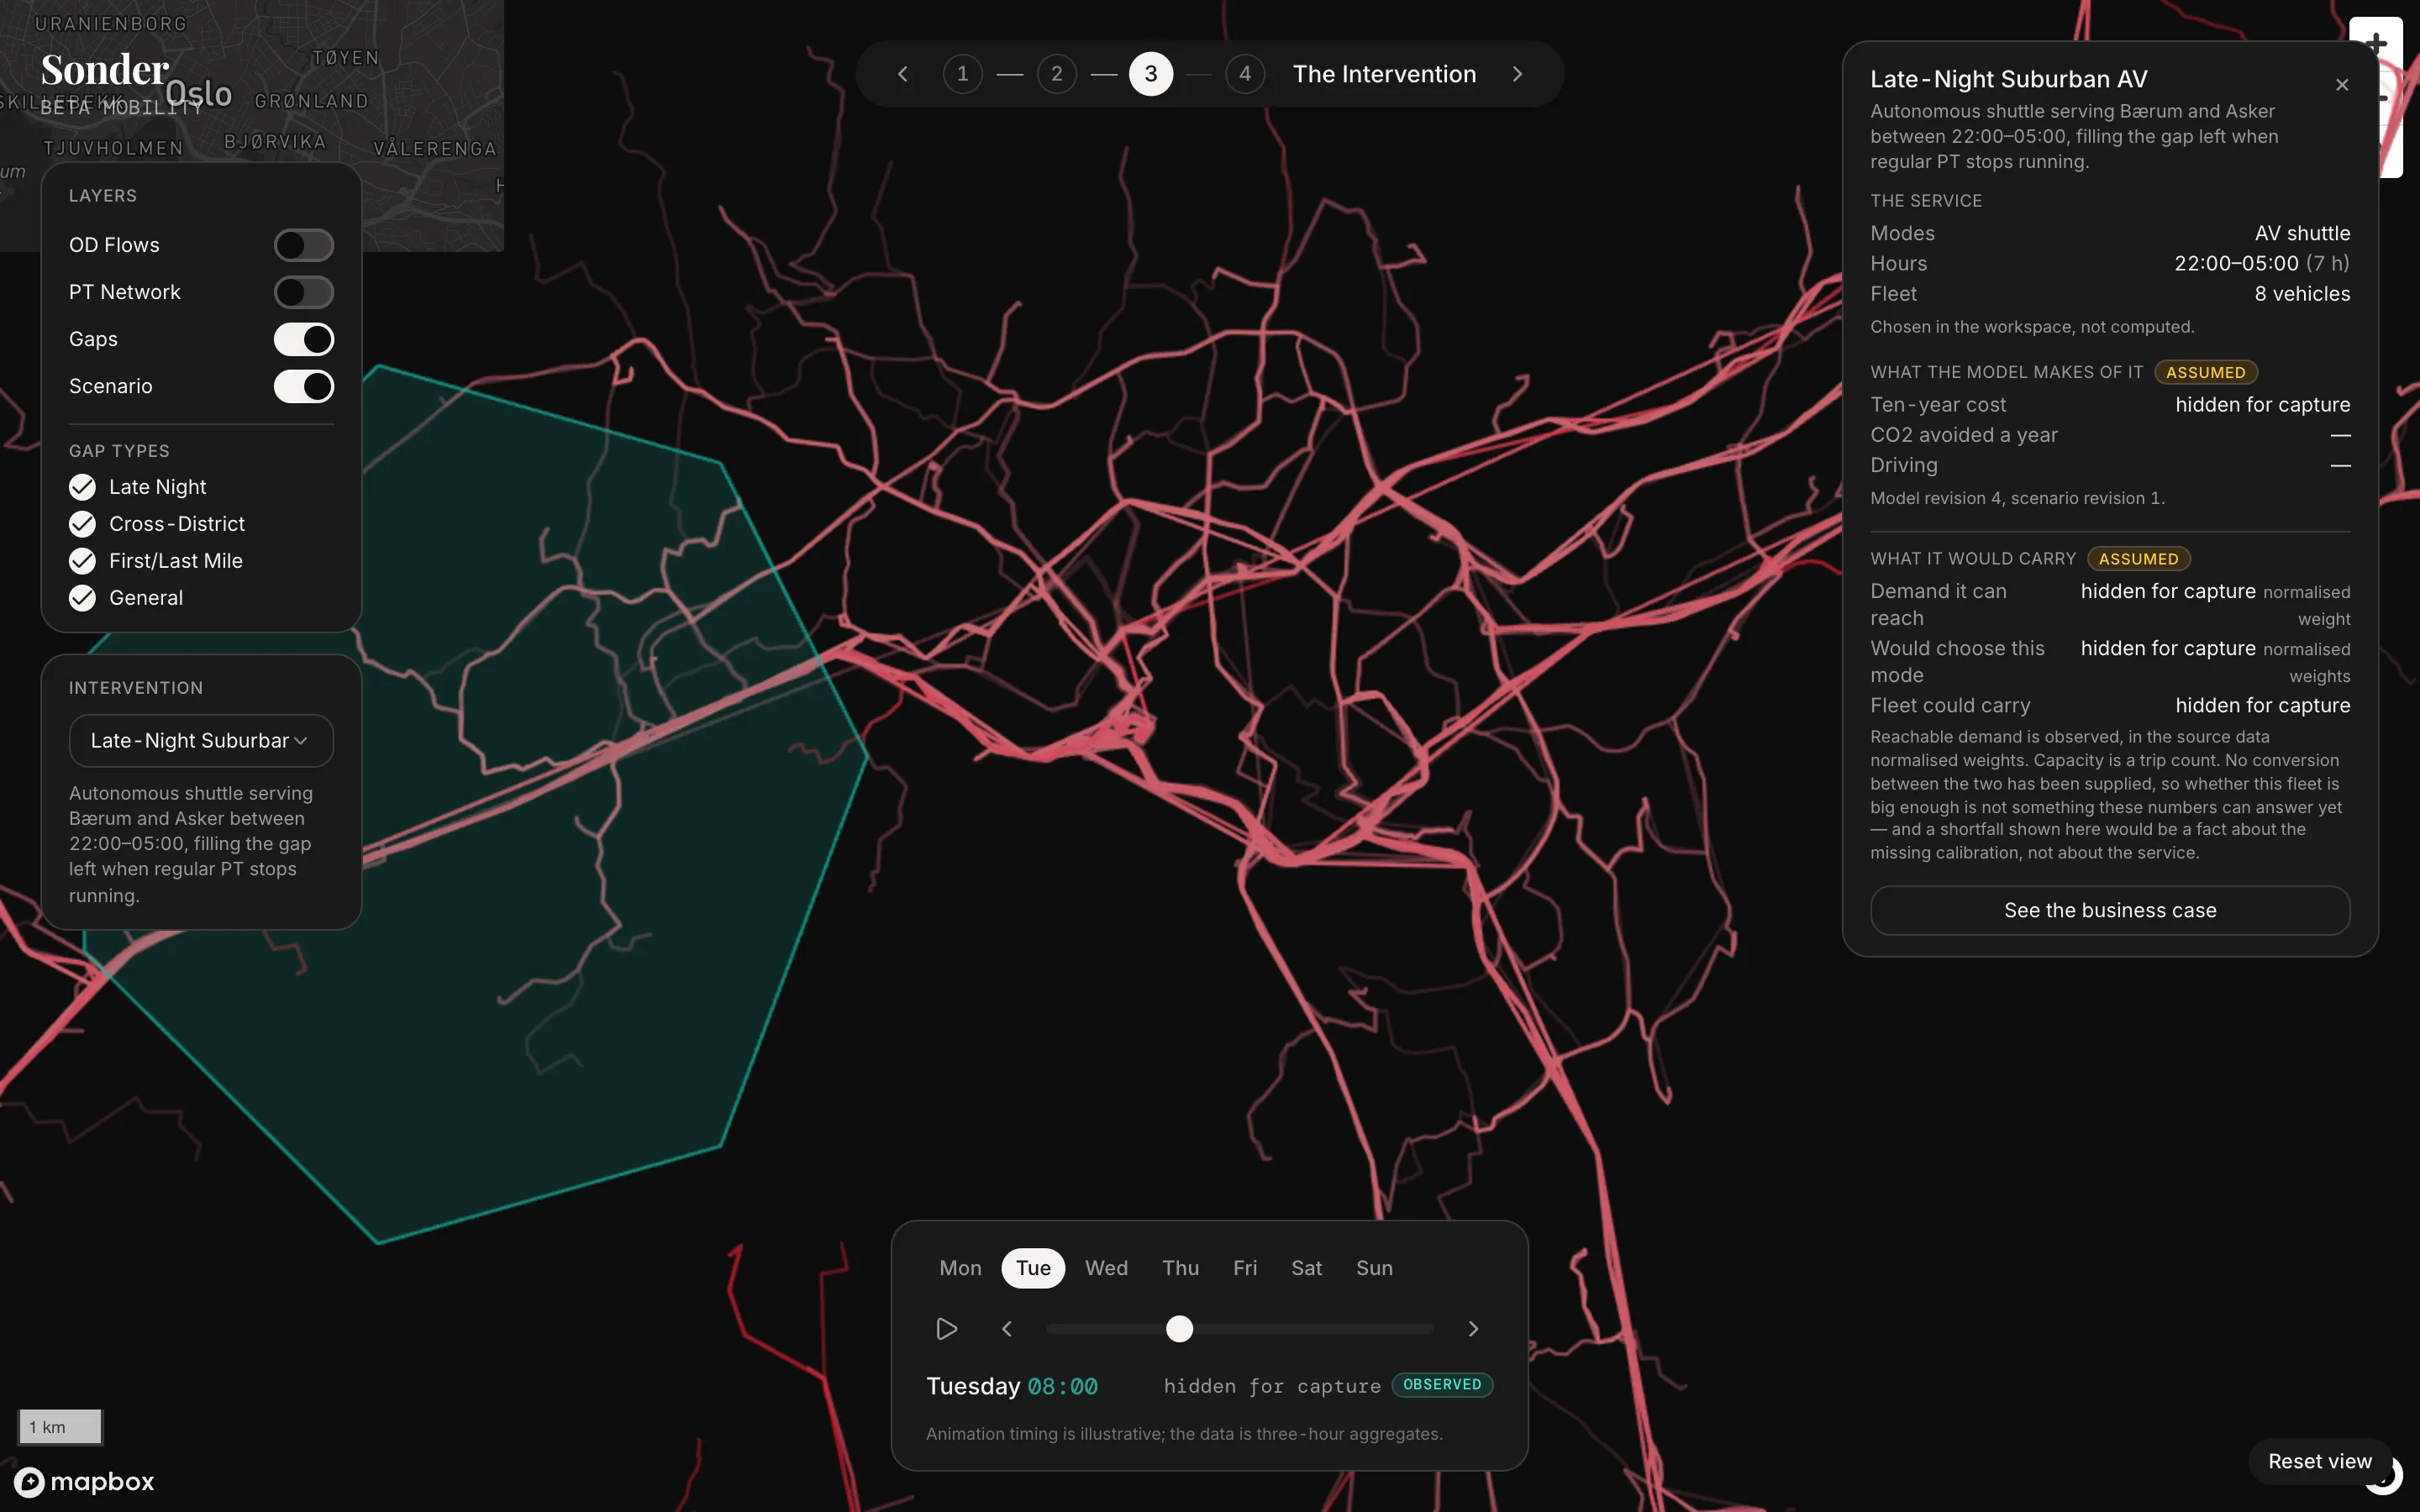
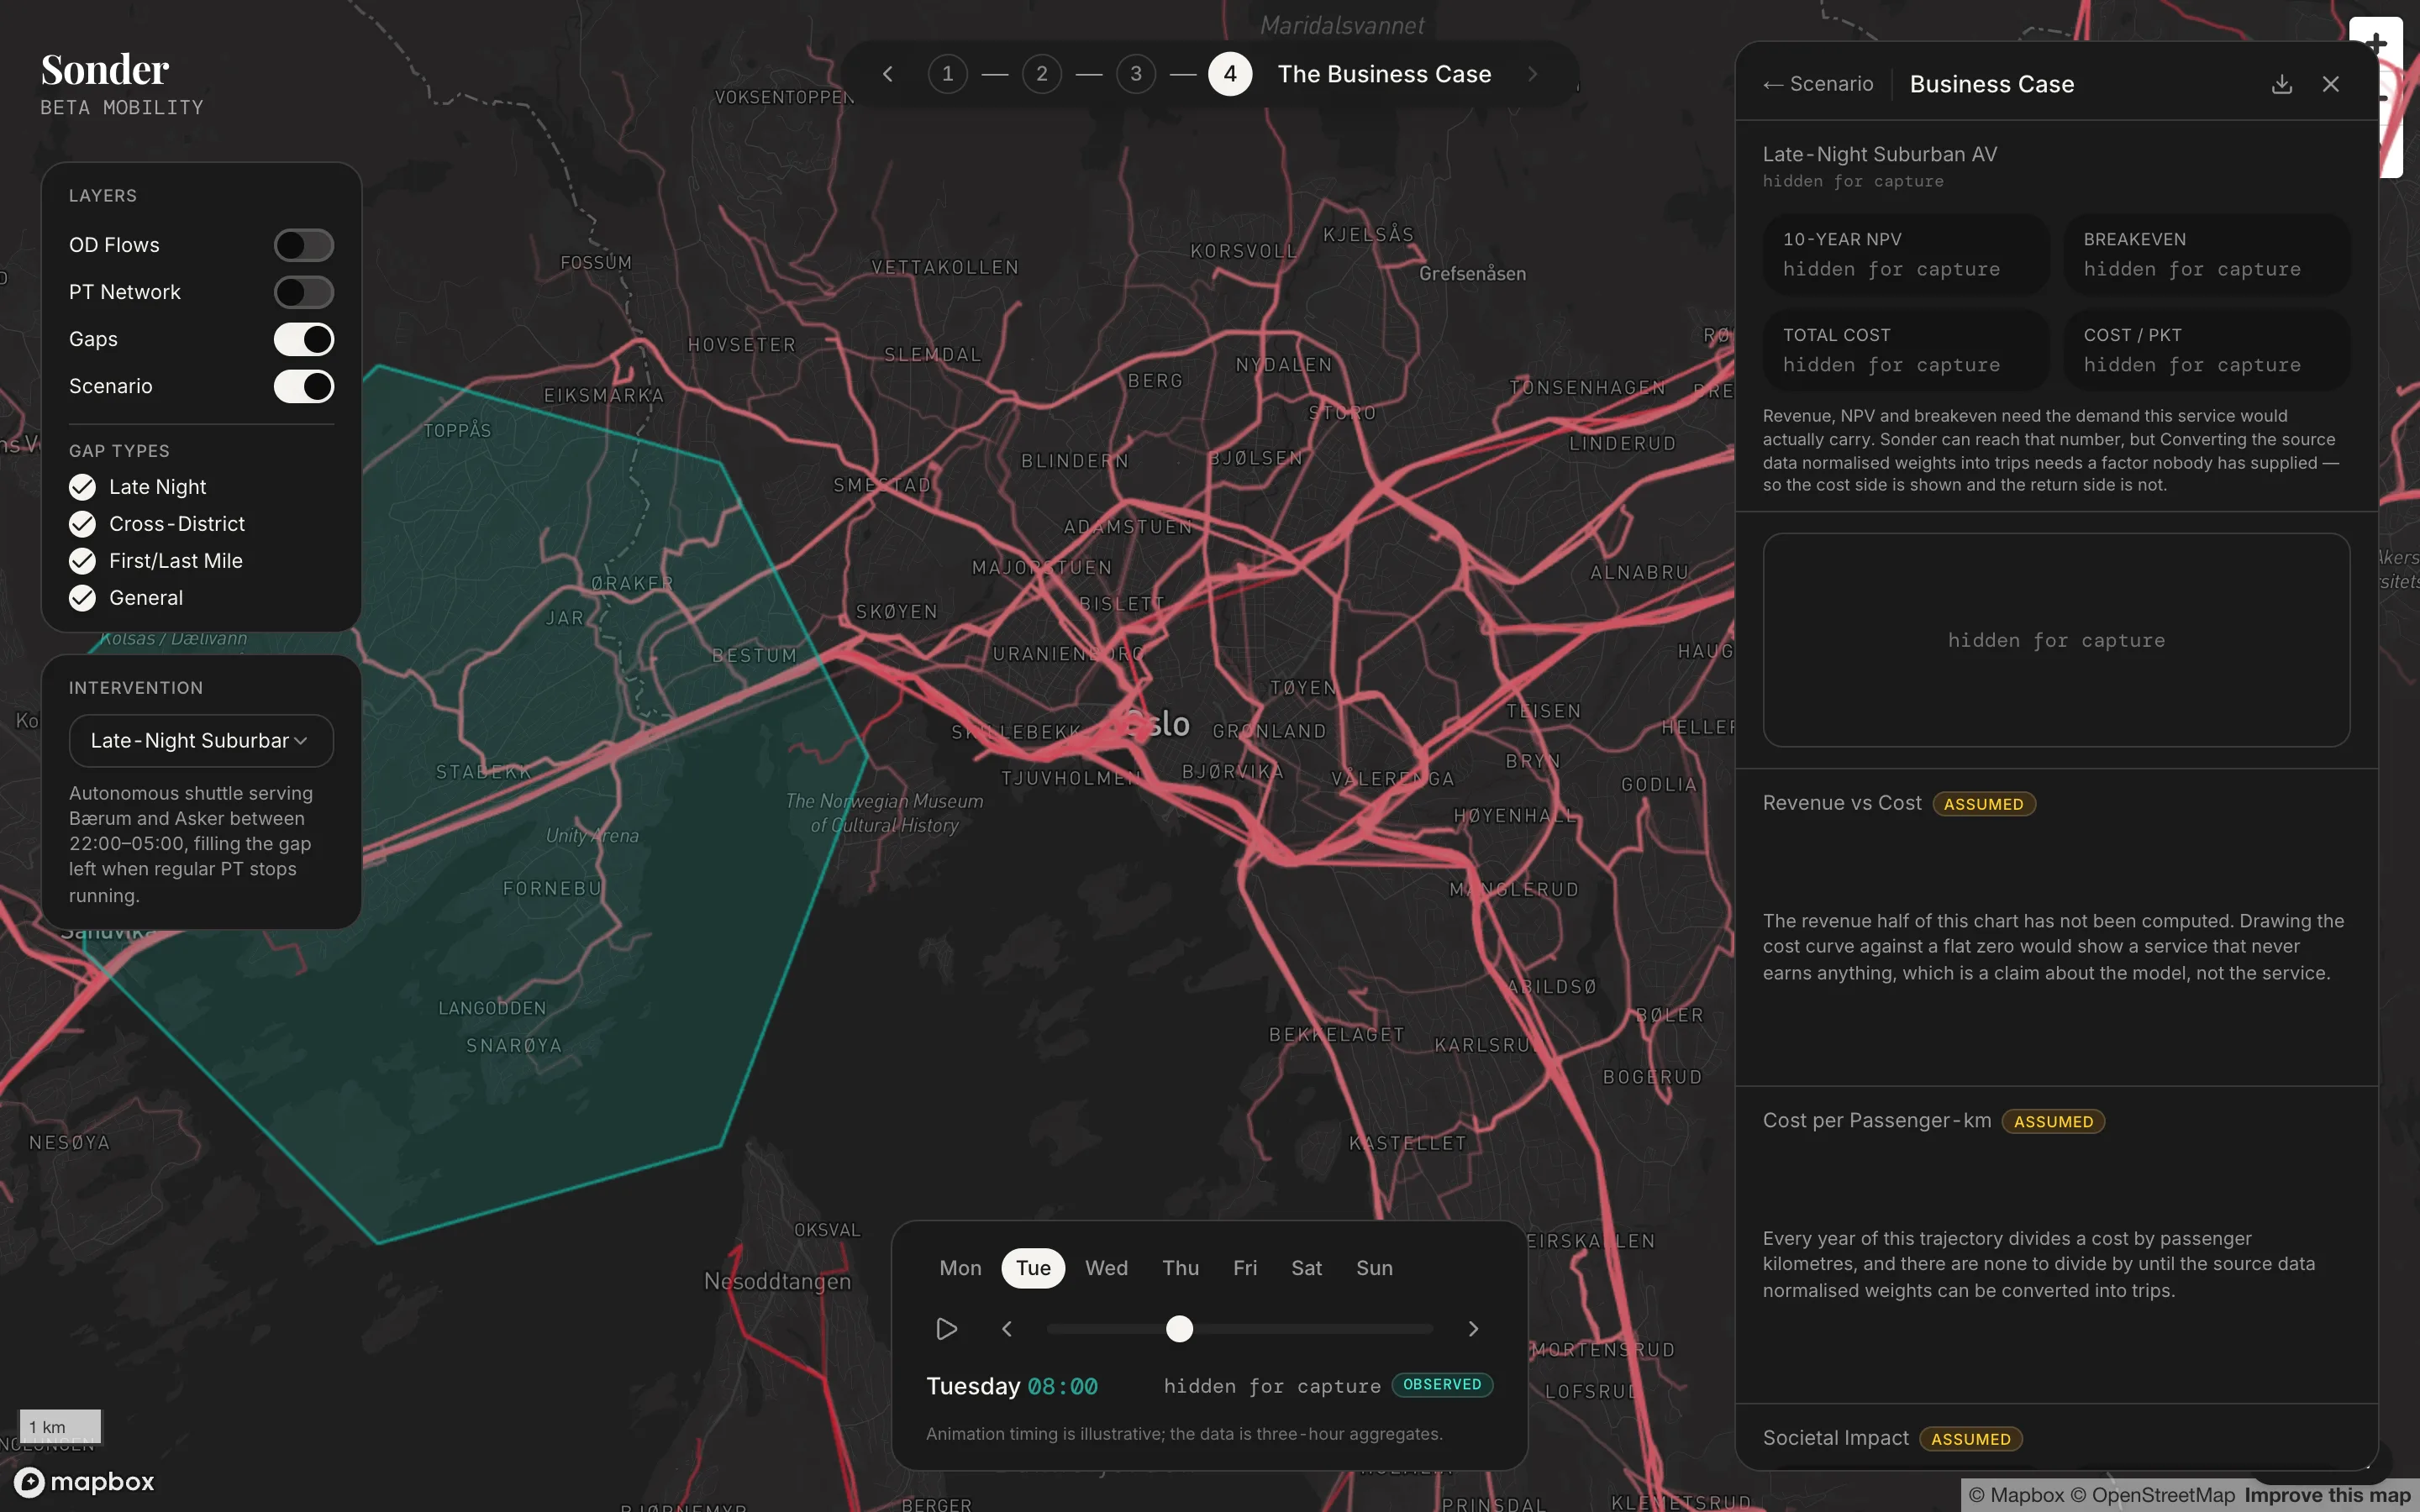
ConfigureA zone, a fleet, operating hours, a fare. Change one and the rest follows.
AnalyzeCost per passenger kilometre, and the ridership the service would need to pay for itself, with every assumption labelled.
One map, one dataset, four tabs. Every score points back to the trips behind it.
Four labels. The weakest one wins.
Every figure in Sonder carries a label saying how it was made.
ObservedMeasured in the source data and carried through without a model.
InferredComputed from observed data by a documented rule defined here.
AssumedComputed from parameters that were assumed, not measured.
IllustrativeChosen to demonstrate the interface. Not a calculated result.
A figure built from several inputs takes the weakest label of the lot. A figure that would need a factor nobody has supplied stays empty, with the reason next to it.
To move the assumed figures toward measured ones we need two things from you: a way to turn the weights in your movement data into counted trips, and your own cost and fare parameters in place of ours.